I assume that you know about HTTP, WebSocket, Nginx, Spring Boot (Doesn't matter)
Setup
I was working on a multi tenant web app from scratch, which has a real-time chat feature. So, obviously i need to have WebSocket in my app. The setup is very simple, client will make request to nginx, nginx will proxy requests to spring-cloud-gateway and spring-cloud-gateway will again proxy request to appropriate backend.
spring-cloud-gateway was introduced in middle of request, authenticate request and value user permission, extracting tenantId from request host to forward it to backend, etc.
Client (Web/Mobile)
        │
        ▼
     [NGINX] - localhost:80
        │
        ▼
[Spring Cloud Gateway] - localhost:8080
        │
        ▼
  WebSocket Backend (Spring Boot) - [localhost:9001,localhost:9002]
The Error
Everything was working fine as long as creating websocket connection to ws://localhost:8080/api/ws. Because i was developing a multi-tenant app, i needed to test whether websocket connection would still be established when i make request using domain name, e.g ws://example.com/api/ws.
/apiis the prefix path for all http enabled backend
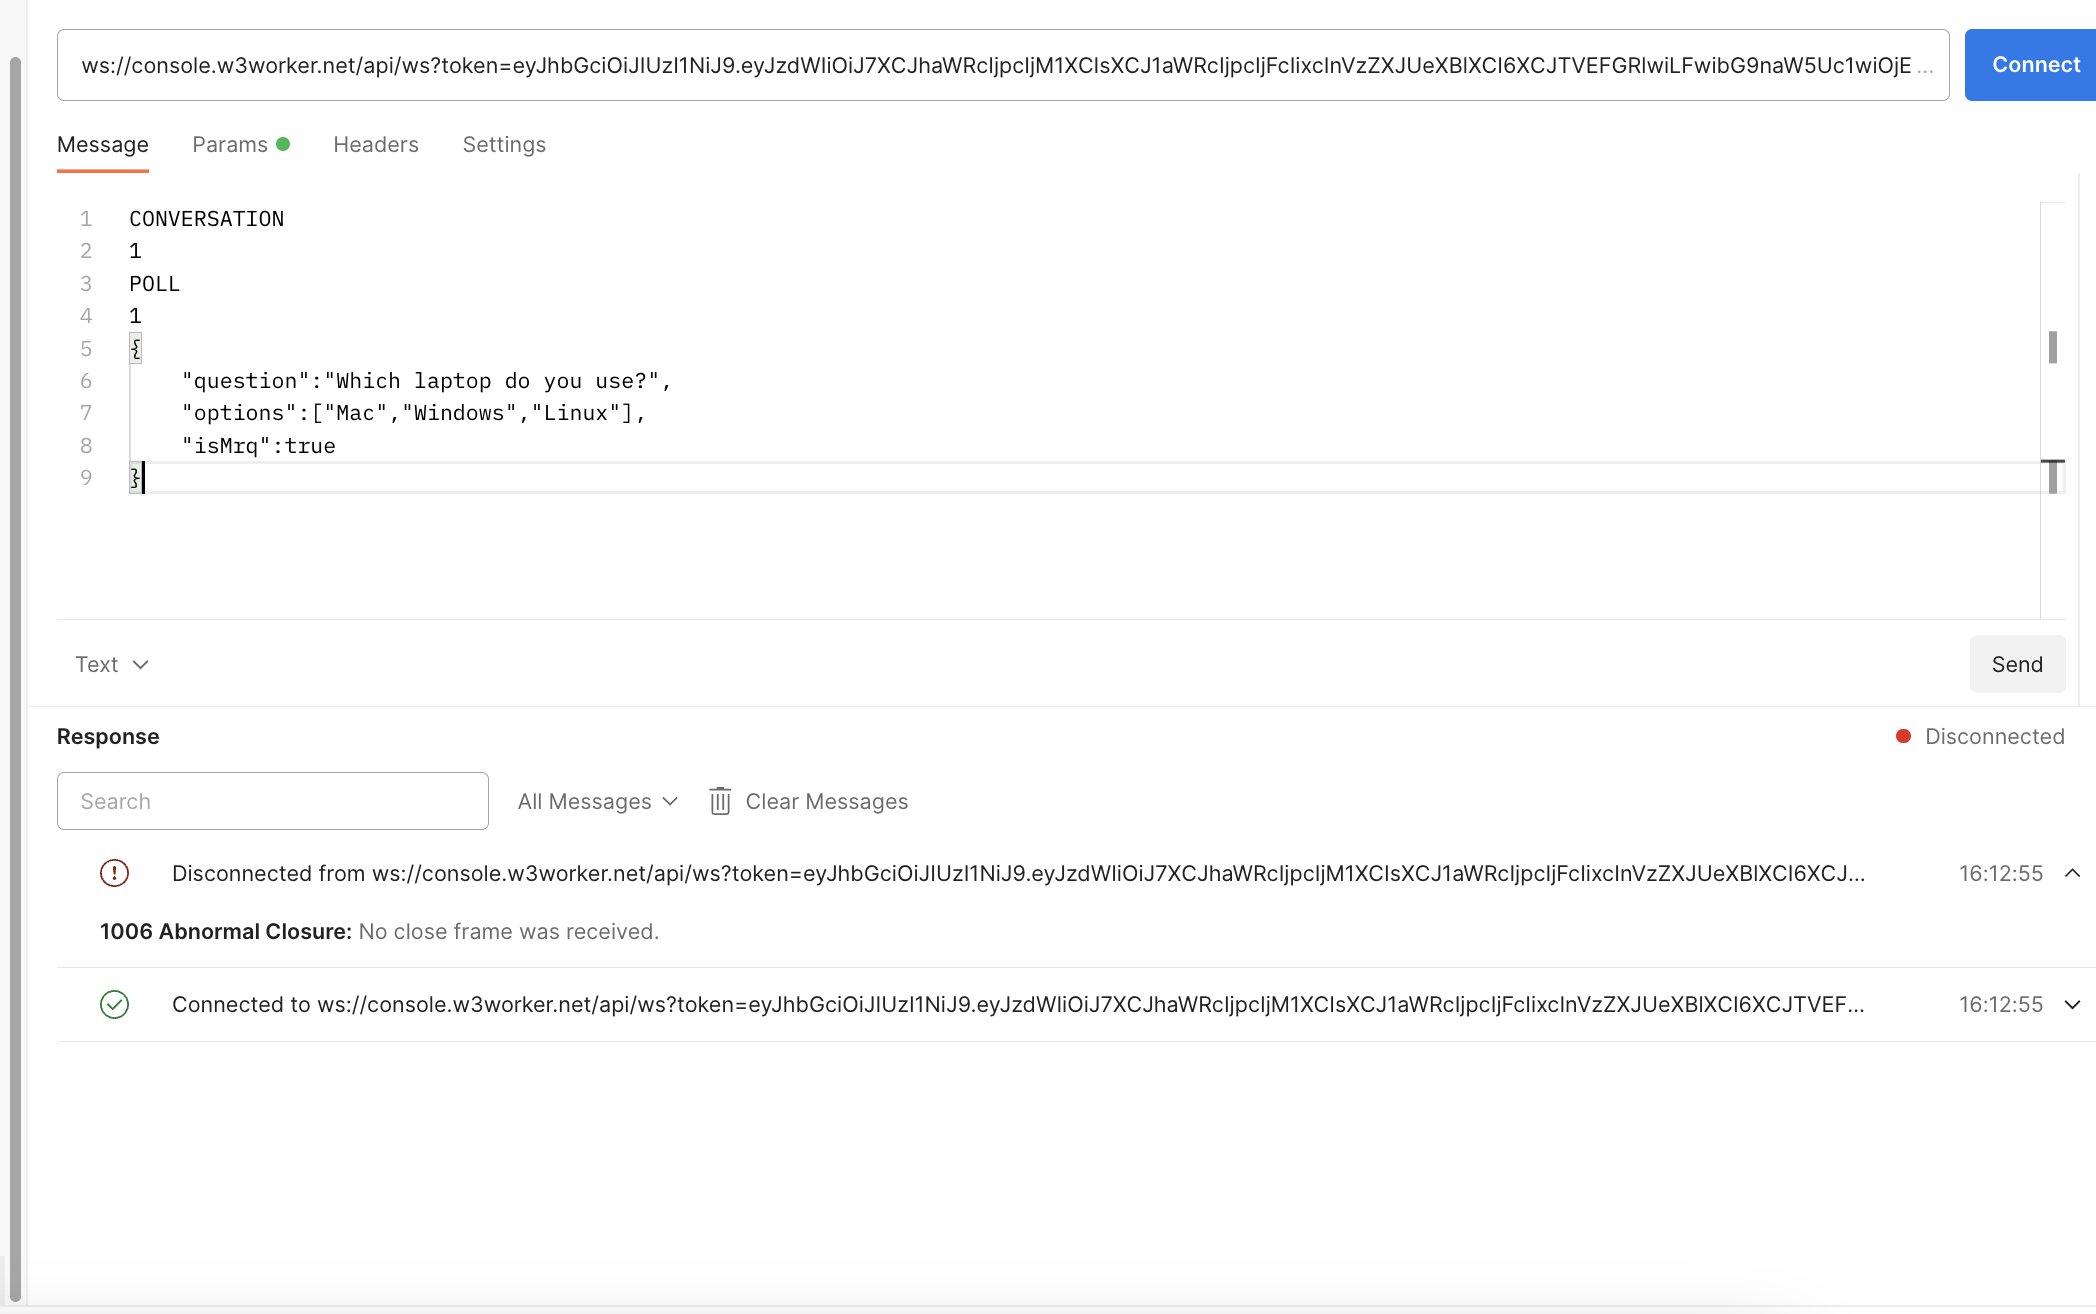
When i tested i got the below error in postman, 1006 Abnormal Closure:No close frame was received. WebSocket connection was disconnecting just after connection established.
The first step
The first step when i encounter the error was to know about the error code and when it occur, try out different things to see if it's working or not.
Upon doing google search and ChatGPT i found that this error code is emitted by browser upon any error in websocket connection. The same setup was working on localhost:8080 and there wasn't any error log in spring boot terminal, neither on gateway terminal nor on backend terminal. Everything was looking normal.
Because, domain request was proxied by nginx. I checked if required headers for websocket connection is present or not, e.g $http_upgrade. They were looking fine at first.
Debugging Begins
There was three components to debug and see what's where is the problem, 1> nginx, 2> gateway, 3> WebSocket backend.
I started with gateway, because gateway has multiple filters applied, authentication/authorization, and routing.
I checked gateway code, debugged on each steps and they are looking fine in both cases localhost:8080 and when using domain name.
I still had doubts, so i commented out filters, authenticate/authorization to see if it's working or not.
After debugging gateway, i debugged web socket backend. I added debugger at the very start of websocket connection. I found that debugger was never triggered when using domain name but it was always working with localhost:8080.
I thought there could be CORS error, i checked web socket backend CORS policy, it had complex logic. So, i made a change to allow all origins in web socket backend.
@Configuration
@EnableWebSocket
public class WebSocketConfig implements WebSocketConfigurer {
  @Autowired private WebSocketMessageHandler webSocketMessageHandler;

  @Override
  public void registerWebSocketHandlers(WebSocketHandlerRegistry registry) {
    registry
        .addHandler(webSocketMessageHandler, "/ws")
        .setAllowedOrigins("*");
  }
}
I still had the same error. Now, it was clear that either gateway is not proxying request for domain name to backend or spring-boot based web socket backend is terminating the request on framework level. To confirm that, i enabled trace logging in web socket backend. I wasn't getting any trace log in web socket backend when using domain name, while there were tons of logs when using localhost:8080.
At this point, it was clear that gateway is not proxying the request to web socket backend. So, i started debugging gateway again.
I enabled trace logging in gateway as well, because i wasn't getting any error logs from gateway.
I thought of comparing trace logs when request made to localhost:8080 or domain name.
I made one request to domain name and localhost:8080 and copied their trace logs to a file. After comparing logs file, i found some noticeable differences in their logs.
Diff #1 - HTTP Version
logs for domain name
timeout completed: keys processed=0; now=1752380467451; nextExpiration=1752380467449; keyCount=0; hasEvents=false; eval=false
timeout completed: keys processed=0; now=1752380468453; nextExpiration=1752380468451; keyCount=0; hasEvents=false; eval=false
Counting up[http-nio-8080-Acceptor] latch=1
Before fill(): parsingHeader: [true], parsingRequestLine: [true], parsingRequestLinePhase: [0], parsingRequestLineStart: [0], byteBuffer.position(): [0], byteBuffer.limit(): [0], end: [562]
Socket: [org.apache.tomcat.util.net.NioEndpoint$NioSocketWrapper@6627958e:org.apache.tomcat.util.net.NioChannel@2ba075a3:java.nio.channels.SocketChannel[connected local=/127.0.0.1:8080 remote=/127.0.0.1:51387]], Read from buffer: [0]
Socket: [org.apache.tomcat.util.net.NioEndpoint$NioSocketWrapper@6627958e:org.apache.tomcat.util.net.NioChannel@2ba075a3:java.nio.channels.SocketChannel[connected local=/127.0.0.1:8080 remote=/127.0.0.1:51387]], Read direct from socket: [562]
Received [GET /api/ws?token=eyJhbGciOiJIUzI1NiJ9.eyJzdWIiOiJ7XCJhaWRcIjpcIjM1XCIsXCJ1aWRcIjpcIjFcIixcInVzZXJUeXBlXCI6XCJTVEFGRlwiLFwibG9naW5Uc1wiOjE3NTIzMDI0NTg3MjgsXCJyb2xlc1wiOjF9IiwiZXhwIjoxNzU0ODk0NDU4LCJpYXQiOjE3NTIzMDI0NTh9.1LZeXD3RczGMYuPRyzd6HcIojbTrPB8zVBkk6Hm6ozo HTTP/1.0
logs for localhost:8080
Counting up[http-nio-8080-Acceptor] latch=1
Before fill(): parsingHeader: [true], parsingRequestLine: [true], parsingRequestLinePhase: [0], parsingRequestLineStart: [0], byteBuffer.position(): [0], byteBuffer.limit(): [0], end: [562]
Socket: [org.apache.tomcat.util.net.NioEndpoint$NioSocketWrapper@233eeb8c:org.apache.tomcat.util.net.NioChannel@2ba075a3:java.nio.channels.SocketChannel[connected local=/127.0.0.1:8080 remote=/127.0.0.1:51505]], Read from buffer: [0]
Socket: [org.apache.tomcat.util.net.NioEndpoint$NioSocketWrapper@233eeb8c:org.apache.tomcat.util.net.NioChannel@2ba075a3:java.nio.channels.SocketChannel[connected local=/127.0.0.1:8080 remote=/127.0.0.1:51505]], Read direct from socket: [481]
Received [GET /api/ws?token=eyJhbGciOiJIUzI1NiJ9.eyJzdWIiOiJ7XCJhaWRcIjpcIjM1XCIsXCJ1aWRcIjpcIjFcIixcInVzZXJUeXBlXCI6XCJTVEFGRlwiLFwibG9naW5Uc1wiOjE3NTIzMDI0NTg3MjgsXCJyb2xlc1wiOjF9IiwiZXhwIjoxNzU0ODk0NDU4LCJpYXQiOjE3NTIzMDI0NTh9.1LZeXD3RczGMYuPRyzd6HcIojbTrPB8zVBkk6Hm6ozo HTTP/1.1
The HTTP version was different when I made the request directly to the gateway running on localhost:8080 compared to when the request was proxied to the gateway through Nginx.
You can see HTTP version in last line of each log, nginx proxied request has HTTP/1.0 and direct gateway request has HTTP/1.1
Diff #2 - Switching Protocols
logs for domain name
spring.cloud.gateway.requests tags: [tag(httpMethod=GET),tag(httpStatusCode=101),tag(outcome=INFORMATIONAL),tag(routeId=ws_server),tag(routeUri=http://localhost:8082),tag(status=SWITCHING_PROTOCOLS)]
[6cdffefe] Completed 101 SWITCHING_PROTOCOLS, headers={masked}
...
Changing async state from [STARTING] to [MUST_COMPLETE]
...
Socket: [SocketChannel[connected local=/127.0.0.1:8080 remote=/127.0.0.1:51387]], Status in: [OPEN_READ], State out: [CLOSED]
Socket: [SocketChannel[connected local=/127.0.0.1:8080 remote=/127.0.0.1:51387]], Status in: [OPEN_READ], State out: [CLOSED]
...
logs for localhost:8080
spring.cloud.gateway.requests tags: [tag(httpMethod=GET),tag(httpStatusCode=101),tag(outcome=INFORMATIONAL),tag(routeId=ws_server),tag(routeUri=http://localhost:8082),tag(status=SWITCHING_PROTOCOLS)]
[29c680fc] Completed 101 SWITCHING_PROTOCOLS, headers={masked}
...
Changing async state from [STARTING] to [MUST_COMPLETE]
...
Socket: [SocketChannel[connected local=/127.0.0.1:8080 remote=/127.0.0.1:51505]], Status in: [OPEN_READ], State out: [OPEN]
Socket: [SocketChannel[connected local=/127.0.0.1:8080 remote=/127.0.0.1:51505]], Status in: [OPEN_READ], State out: [UPGRADING]
Created WebSocket session [0]
[29c680fc] Session id "0" for http://localhost:8080/api/ws?token=...
Connecting to ws://localhost:8082/api/ws?token=...
Connecting endpoint instance of type [org.springframework.web.reactive.socket.adapter.StandardWebSocketHandlerAdapter] to [ws://localhost:8082/api/ws?token=...]
wsFrameServer.onDataAvailable
Socket: [SocketChannel[connected local=/127.0.0.1:8080 remote=/127.0.0.1:51505]], Read from buffer: [0]
Socket: [SocketChannel[connected local=/127.0.0.1:8080 remote=/127.0.0.1:51505]], Read direct from socket: [0]
Socket: [SocketChannel[connected local=/127.0.0.1:8080 remote=/127.0.0.1:51505]], Status in: [OPEN_READ], State out: [UPGRADED]
Registered read interest for [SocketChannel[connected local=/127.0.0.1:8080 remote=/127.0.0.1:51505]]
Writing the HTTP upgrade request from buffer starting at [0] with a limit of [589] from local address [/127.0.0.1:51506]
Created WebSocket session [1]
...
...
It can be seen from above log segments, this log Completed 101 SWITCHING_PROTOCOLS tells that both request are completing HTTP handshake part of the WebSocket request.
[OPEN_READ], State out: [CLOSED] this log tells that gateway is not completing the upgrade properly for nginx proxied request, but working for localhost:8080(Status in: [OPEN_READ], State out: [UPGRADED]).
Gateway immediately closing the socket for write for nginx proxied request, it could be due to client terminated connection or something else.
The culprit
After seeing above differences, it was clear that there is something with connection upgrade. But, still i was not sure about the actual reason.
At this point, i had two paths.
- Debug the network connection to see if the client was terminating the connection in any way (for example, by sending a close frame or closing its write side).
- Verify whether the HTTP version (HTTP/1.0 vs. HTTP/1.1) could be causing issues with the WebSocket upgrade and keeping the connection open.
I decided to go with #2 approach, because i didn't suspect that client would even terminate connection. I had tried multiple clients, browser and postman as well NodeJs script.
After doing some research i found that websocket connection upgrade does not work with HTTP/1.0. Also found that nginx uses HTTP/1.0 by default for upstream connection.
I changed the default protocol for web socket connection in nginx using proxy_http_version 1.1 directive.
I tested connection using domain name again, and this time it was working fine.
Got some relief? Yes. Scratched by body? Yes. Out of chair? Yes.
If you have reached here, enjoy the meme below, because you deserve a break too.

The lesson
At this point, we have seen the error, debugging approaches and the fix. Now, it's time to learn the lesson of debugging so that we can use methods next time when we see any issue.
Below points are included from the debugging we talked in this blog as well as my past experiences.
Lesson #1 - Stack Trace
The first thing we should do is to, look for error stack traces in all services. Stack traces aren't always aAvailable, like in this case. If that happens, then most likely something is wrong with business logic or configuration.
Lesson #2 - Trial and Error
We can try out different inputs and see what's working and what's not. Observe, if behavior and patterns are changing with input.
Lesson #3 - What's changed?
We often suddenly start getting errors, after making some change. Either in configuration or in code. Most of the time, we get the root cause by looking at what's changed.
Lesson #4 - Business Logic
If we did't made any change, no error logs, still not working for some input while working for few inputs. We can suspect that there is something wrong with either configuration or business logic.
We can use debugger feature in IDE to add breakpoints into code and debug step by step to ensure nothing wrong with business logic.
Lesson #5 - Configuration
Sometimes business logic is not the issue, but it's configuration. We can try out different configuration for new input and see if any configuration is working for new input, e.g allowing all origins for CORS to see if there is any CORS issue.
If there is no issue with configuration or business logic, then good luck, it's going to ruine your night.
Lesson #6 - Traces
Most of the tools, services offer logging. They usually have error logging level enabled by default. We can enable trace level logging in service, supply one working input and one not working input. Copy their trace logs to a file, and compare them side by side.
Most of the time, we'll get an idea of what's wrong by traces.
Lesson #7 - Isolation
We can debug in isolation, it allows us to focus on only relevant code/component what matters.
We can create a minimal reproducible example of working code for the part that is causing the issue(e.g websocket connection). We can create the example from scratch or commented out existing code to create minimal reproducible example(This is the easiest way). We can suspect that there is something wrong with either configuration or business logic.
After create minimal reproducible example, we can debug by making changes to code, configuration or anything.
Lesson #8 - Break by components
If working on micro-service, error can be caused due to any service in the request chain. For example, as we have seen in this blog error was caused due to nginx.
The idea of break by components is to list down all component/services involved in your request chain. Think about what you are doing, what could go wrong with any service.
Then we can debug and focus on specific service accordingly.